

4. Safety of GCP
Isoflavones have been taken daily as components of soybean and soybean products in Asian countries, especially in Japan. This indicates that isoflavones are safe components for human beings because they have been present in the human diet for thousands years. On the other hand, Basidiomycetes, such as Lentinus elodes and Ganoderma lucidum, have been used as a kind of food and a folk medicine.
In order to clarify the safety of GCP to human, an oral single dose toxicity study and a one-month toxicity study were done in mice.
Single dose toxicity study of GCP
Animals: 7 weeks old ddY mice were used in this study. Animals were divided into 2 groups with 16 mice (8 male and 8 female) as GCP-treated group and with 10 mice (5 male and 5 female) as the control group. Animals were kept at a constant temperature (24 � 2oC) and humidity (55�20%) under a 12 hr light/dark cycle.
Administration of GCP: GCP was suspended in tap water and orally administered at a dose of 15g/kg body weight (25 ml GCP solution/kg body weight). Mice in the control group were administered with equal volume of tap water.
Observations: GCP was administered to the mice p.o. in a practicable maximum dose. No deaths occurred within 24 hr after administration of GCP (Table 1). The observation was continued for one month and no unusual change related to the administration of GCP was observed.
Table 1. Single dose toxicity study of GCP
Experimental Groups
Alive/Tested
GCP-treated 16/16 Control 10/10 Result: No acute toxicity found in acute toxicity test.
One-month toxicity study of GCP
Method: Animals: Male and female, 7 weeks old, ddY mice were used in the present study and divided into 3 groups with 10 - 15 mice. Animals were kept at a constant temperature (24 � 2oC) and humidity (55 �20%) under a 12 hr light/dark cycle.
Administration of GCP: GCP was incorporated into AIN-76 standard powder diet at the contents of 0.06% and 1.5%. The GCP diets were provided to the mice for 4 weeks. The control group was fed with the standard powder diet without GCP. Mice were given free access to feed and water.
Observation: At the end of experimental period, mice were killed and whole blood and serum were obtained by routine procedures. The numbers and differentiation of whole blood cells were counted and organs were weighted. The serum concentration of total cholesterol, triglycerides, blood urea nitrogen (BUN), glucose, glutamic oxaloacetic transaminase (GOT), bilirubin, albumin and alkaline phosphatase (ALP) were measured with detection kits. The serum protein was determined by using Lowry's method.
Statistics Analysis: All the results were expressed by mean � SE, comparison between different groups were analyzed by ANOVA and Fisher's PLSD test.
Results: Changes of body weight gain, organ weights and food consumption and other blood, urine parameters were shown in Table 2 to Table 6. No abnormalities were found in all tests.
Table 2. Body weight gain, organ weights and food consumption
Items Control 0.06% GCP 1.5% GCP male female male female male female Body weight gain (g/28 days) 10.4 � 2.4 9.3 � 1.5 10.6 � 1.6 6.9 � 1.6 10.7 � 3.3 8.2 � 0.5 Diet intake (g/mouse/day) 5.2 4.6 4.9 4.6 4.2 4.5 GCP intake (mg/mouse/day) 0 0 2.94 2.76 63.0 67.5 Liver (g) 1.41 � 0.18 1.79 � 0.08 1.37 � 0.14 1.64 � 0.11 1.51 � 0.13 1.69 � 0.10 Heart (g) 0.16 � 0.02 .17 � 0.02 0.14 � 0.02 0.17 � 0.0 0.14 � 0.02 0.14 � 0.01 Kidneys (g) 0.51 � 0.06 0.42 � 0.02 0.51 � 0.06 0.42 � 0.01 0.51 � 0.04 0.40 � 0.03 Spleen (g) 0.16 � 0.05 0.13 � 0.01 0.13 � 0.04 0.17 � 0.01 0.14 � 0.02 0.16 � 0.02 Testis (g) 0.28 � 0.04 0.29 � 0.03 0.29 � 0.04 Ovary (g) 0.04 � 0.01 0.05 � 0.01 0.03 � 0.01 Uterus (g) 0.10 � 0.03 0.10 � 0.02 0.10 � 0.01 Table 3. Lipid, glucose and BUN levels in serum
Items Control 0.06% GCP 1.5% GCP Glucose (mg/dl) 137.4 � 31.6 129.5 � 20.9 118.4 � 22.4 BUN (mg/dl) 24.8 � 3.9 23.7 � 4.4 27.3 � 5.0 Total Cholesterol (mg/dl) 154.4 � 11.6 163.0 � 8.2 137.6 � 7.0 Triglyceride (mg/dl) 96.6 � 12.8 120.4 � 12.9 112.3 � 8.5 Table 4. Liver function indices in serum
Items Control 0.06% GCP 1.5% GCP GOT (IU/I) 19.8 � 5.6 17.8 � 6.9 20.1 � 5.7 Total billirubin (mg/dl) - - - Direct billirubin (mg/dl) - - - Albumin (g/dl) 3.81 � 0.45 3.93 � 0.39 3.63 � 0.07 Total Protein (g/dl) 6.49 � 0.31 5.79 � 0.48 6.00 � 0.11 A/G Ratio 1.72 � 0.29 1.85 � 0.16 1.61 � 0.11 Table 5. The number of red blood cell, white blood cell and platelet in peripheral blood
Items Control 0.06% GCP 1.5% GCP RBC (x105cell/ � l) 110.8 � 8.2 105.8 � 6.7 95.3 � 4.5 WBC (x102cell/ � l) 59.0 � 3.6 44.0 � 3.38 55.1 � 4.86 Platelet (x105cell/ � l) 3.32 � 0.25 3.85 � 0.41 3.75 � 0.33 Table 6. Differentiation of peripheral blood cells
Items Control 0.06% GCP 1.5% GCP Monocytes (%) 2.8 � 0.8 1.9 � 0.3 2.6 � 0.9 Neutrophilis (%) 22.1 � 3.9 19.5 � 2.0 16.1 � 3.8 Eosinophils (%) 0.4 � 0.2 0.8� 0.3 2.9 � 0.5 Basophils (%) 0.7 � 0.3 0 0 Lymphocytes (%) 71.5 � 3.6 76.3 � 1.6 80.3 � 3.1 Summary:
As seen from the results of the single dose toxicity study of GCP, the LD50 of GCP is more than 15g/kg body weight, which means GCP is a no-toxicity substance in practice. In the one-month toxicity study to feed mice repeatedly, GCP did not show any influences on body weight gain, diet intake, liver, kidney and other organ weights of the mice even when GCP was added into diets to 1.5%. Furthermore, there were no different changes found in lipid, liver and kidney functions, and blood glucose levels. Whole blood cell and percentages of various blood cells in all the groups were in normal ranges, but eosinophil showed an up-regulated tendency in GCP-treated groups. In summary, GCP is a safe as a nutrition supplement.
Table 7. Good for food certification
Items
Standard Values (per 100g)
Lead (Pb) Not detected (not more than 1ppm) Arsenic (as As2O3) Not detected (not more than 0.2ppm) Number of bacteria Not more than 1000 cfu/g Mold and Yeast Not detected Coliforms Negative S.aureuse Not detected Salmonella Negative Human Monitor Test
Method
[Period] 26 May ~ 23 June, 2000
[Groups] Total 27 healthy volunteers including 14 males and 13 females were tested in the monitor test.
The GCP group (7 males and 7 females): GCP was orally administered by 2 g per day at 8 AM. The blood samples were collected and analyzed at the day 0, day 14, and day 28.
The GCP + AHCC group (7 males and 7 females): GCP was orally administered by 2 g per day at 8 AM and AHCC by 3 g per day at 8 PM. The blood samples were collected and analyzed at the day 0, day 14, and day 28.
[Biological parameters]
- Genistein concentration in serum and in urine
- Biochemical parameters of blood and blood cell counts:
ALP, GOT, y -GTP, Uric acid, Creatine, Blood sugar, Total cholesterol, TG, HDL-cholesterol, BUN and WBC, RBC, Hematorcrit, PLTResults
1. Changes of Genistein concentration in serum and in urine after 4 weeks intake of GCP
For the GCP + AHCC group, as similar as in the GCP single group, the genistein concentrations both in serum and in urine are increasing gradually by the four weeks intake. It suggests that AHCC does not influent the absorption and metabolism of GCP in human being (Fig. 2 and Table 8).
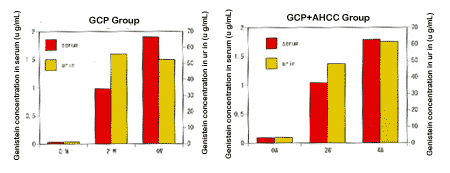
Fig. 2 Changes of Genistein concentration in blood and in urine after 4 weeks intake of GCP
2. Biological Parameters in Blood
Table 8. Biological Parameters in Blood
0W GCP group 2W 4W 0W GCP+AHCC group 2W 4W GOT (U/dL) 19.5 � 4.0 19.2 � 5.5 18.7 � 5.1 19.2 � 4.8 20.0 � 5.8 18.6 � 4.9 GPT (U/dL) 20.5 � 11.2 21.6 � 13.1 20.371 � 10.7 19.4 � 12.4 18.1 � 11.3 16.6 � 8.9 ALP (U/dL) 191.1 � 39.9 197.5 � 49.5 197.1 � 45.5 214.4 � 59.8 214.3 � 8.03 215.4 � 72.8 y -GTP (U/dL) 26.5 � 18.4 26.2 � 18.9 25.3 � 14.6 28.6 � 28.0 26.8 � 28.5 24.8 � 21.4 Glucose (mg/dL) 98.9 � 16.8 96.3 � 18.8 104.8 � 16.4 97.9 � 28.9 85.9 � 18.3 96.4 � 26.5 T-Ch (mg/dL) 181.1 � 22.6 182.3 � 21.8 180.5 � 19.9 180.57 � 34.13 179.8 � 39.7 182.6 � 35.8 HDL-Ch (mg/dL) 57.4 � 18.3 56.5 � 17.6 57.7 � 18.7 64.4 � 17.0 63.0 � 17.6 66.3 � 18.2 TG (mg/dL) 89.5 � 57.5 87.6 � 68.1 97.3 � 58.2 78.0 � 33.3 78.3 � 43.9 81.7 � 40.2 Uric acid (mg/dL) 5.2 � 1.3 5.3 � 1.2 5.0 � 1.4 5.0 � 1.3 5.1 � 1.4 4.8 � 1.4 BUN (mg/dL) 13.6 � 2.8 13.5 � 3.3 14.2 � 3.0 14.8 � 3.4 13.4 � 2.9 13.7 � 3.4 Creatine (mg/mL) 1.0 � 0.2 1.0 � 0.2 1.0 � 0.1 1.0 � 0.2 0.9 � 0.2 0.9 � 0.2 Blood cell counts WBC (x 103 cell / � L) 6.6 � 2.1 7.1 � 2.5 7.3 � 2.3 6.2 � 1.7 6.5 � 1.6 5.7 � 1.0 RBC (cell / � L) 460 � 45.2 440 � 140.1 460 � 47.9 468 � 48.3 474 � 46.8 469 � 50.1 Hematocrit (%) 42.9 � 3.8 42.5 � 4.5 42.6 � 4.5 44.0 � 3.9 43.3 � 4.0 43.8 � 4.4 Platelet (cell / � L) 23.4 � 5.4 23.83 � 6.9 24.2 � 6.5 22.2 � 4.8 21.0 � 4.3 21.2 � 4.1 No abnormal parameters could be found during the 4 weeks in both the GCP group and the GCP + AHCC group.
Home | | News | Poster Presentation
![]()
GCPresearch.com P.O. Box 311 Rye, NY 10580
Tel: (914) 251-0255 E-fax: (775) 599-7918
Email: [email protected]